Blog · product
Introducing Diagramly, a hand-drawn diagram maker that runs in your browser
Diagramly turns a typed line like "Client -> API -> DB" into a hand-drawn diagram. Free, no sign-up, and the sketch stays on your device until you share it.
I built Diagramly because I kept drawing the same thing on whiteboards and never had it afterwards. A photo of a whiteboard is not a diagram. And every "proper" diagram tool wanted me to pick a shape, drag it out, pick another, find the connector tool, and by then the conversation had moved on.
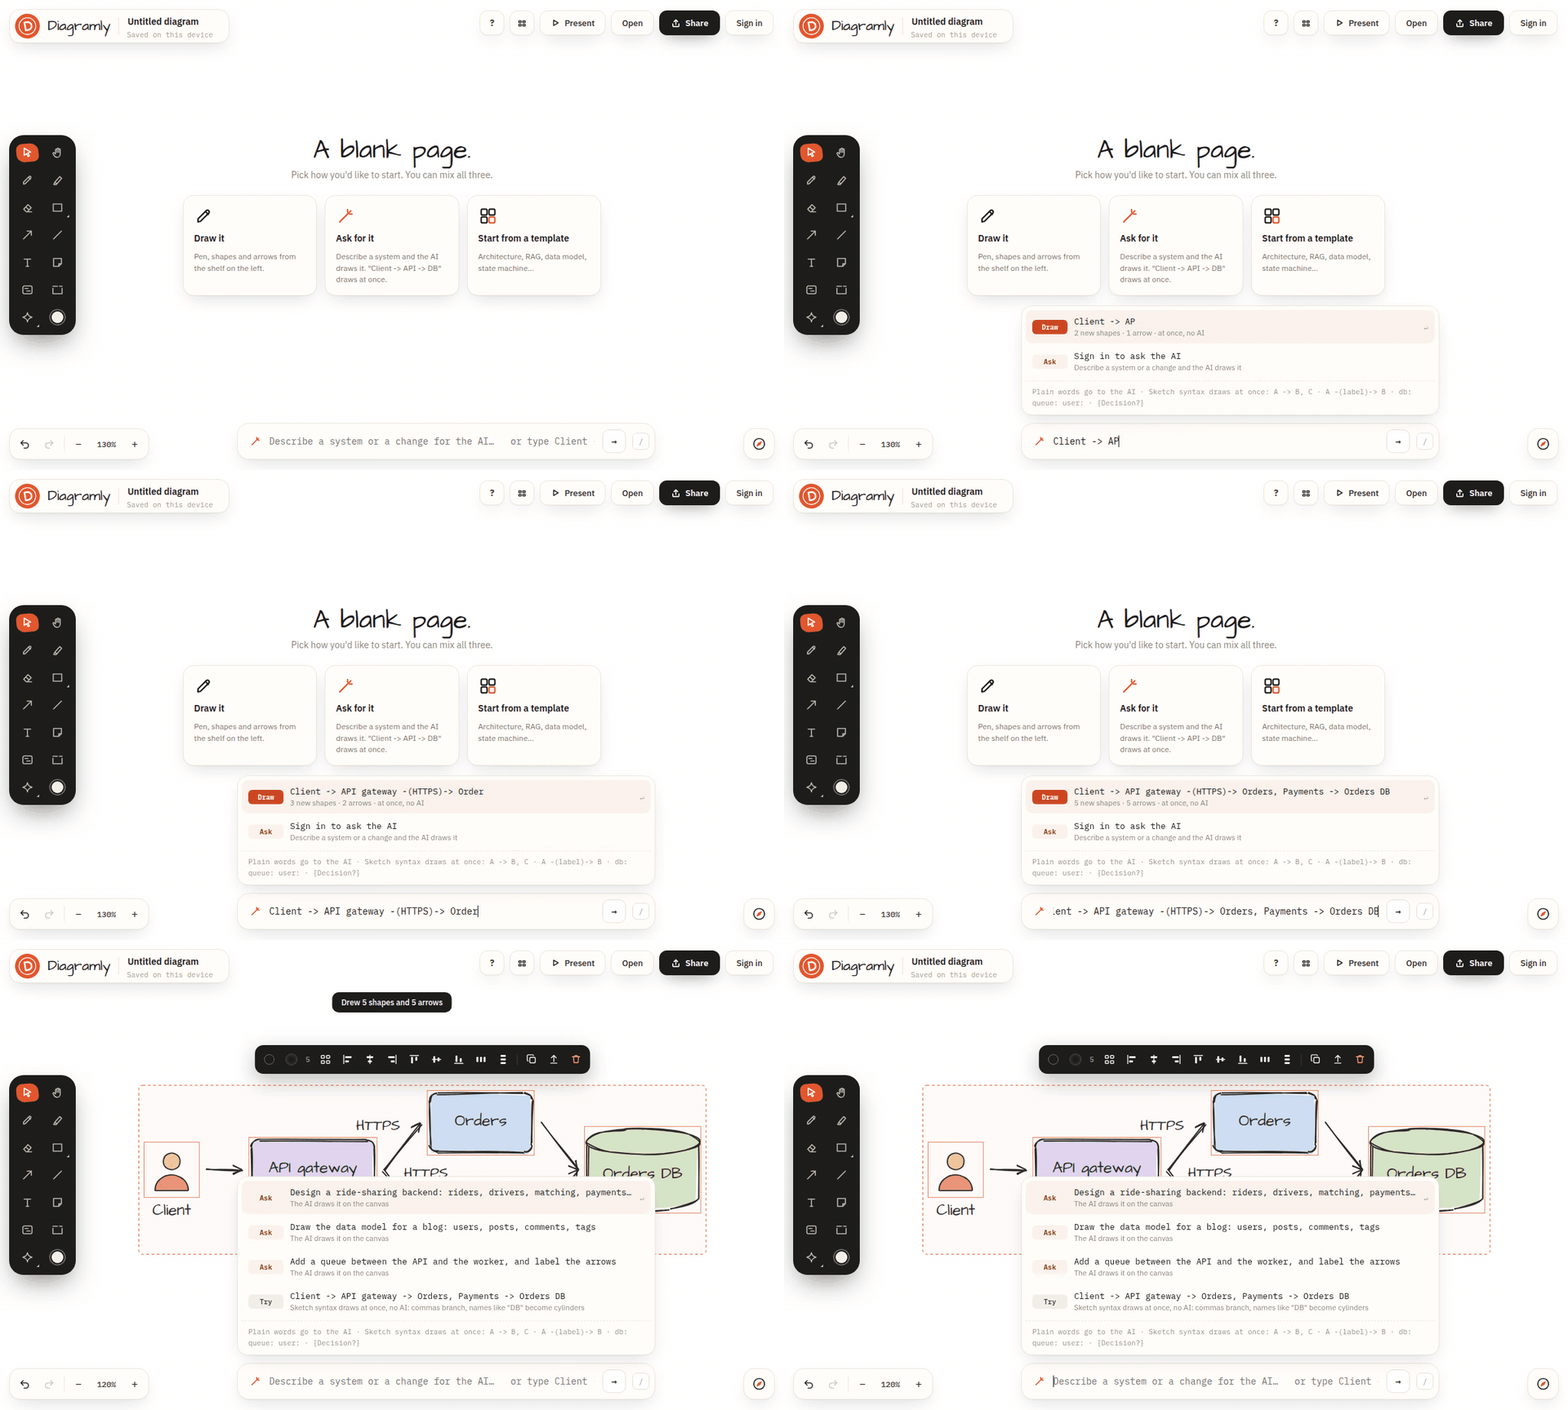
So here's the idea in one GIF. You type what you mean, and the diagram draws itself.
What it actually is
Diagramly is a free diagram maker that runs in the browser. It draws hand-drawn diagrams: boxes, arrows, databases, queues and notes that look like someone sketched them with a pen, but laid out by the engine so nothing needs nudging into line. It's made for the diagrams people draw at work:
- system architecture, with services, stores, queues and the arrows between them
- flowcharts with decisions and branches
- data models with tables and keys
- state machines, pipelines, mind maps
There's no account to make and nothing to install. You open the canvas and start. The sketch is saved in your browser as you go.
Typing is the fast way, drawing is still there
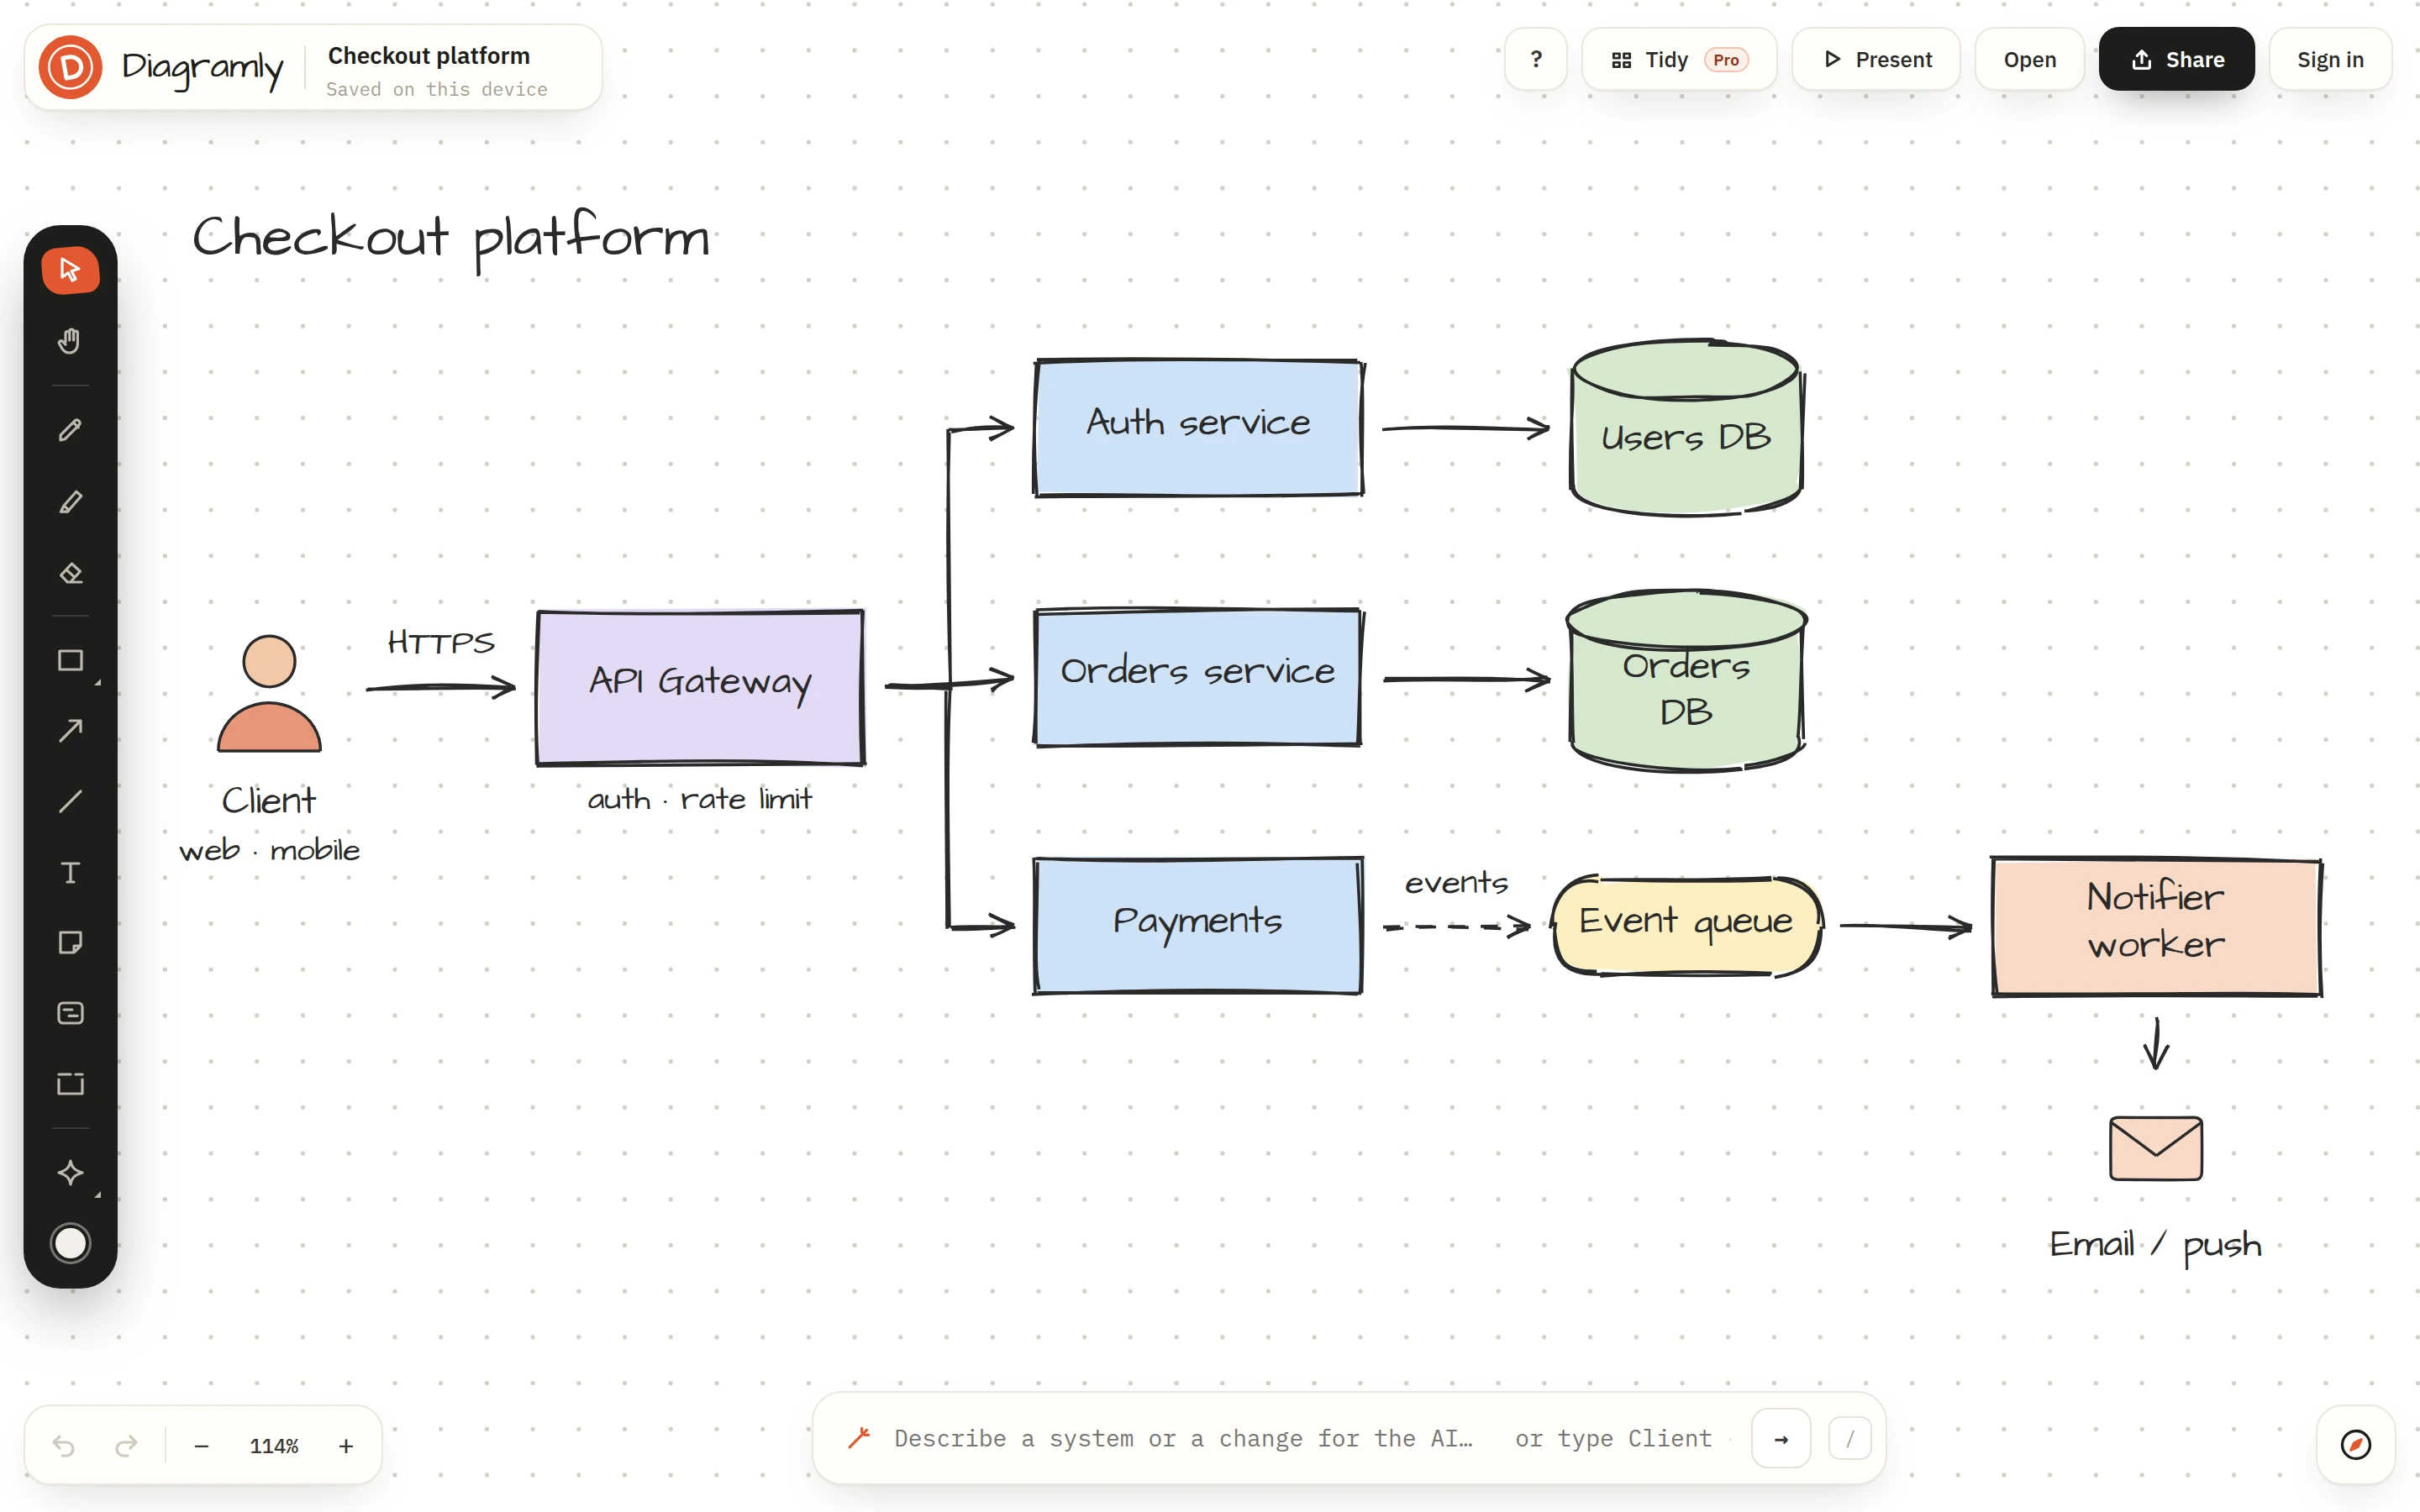
The sketch line is a shortcut, not a cage. On the left there's a pen, a highlighter, an eraser, shapes, arrows, text, sticky notes, cards and frames. Right-click anywhere (or long-press, or tap Space) and a dial opens at your pointer; flick toward a tool to pick it. Arrows stick to shapes and follow them when you move them.
There are about thirty block types beyond plain boxes: tables with keys, API routes, code, checklists that tick, metrics with sparklines, phones, documents, and frames that group things and fold into a chip. And around ninety icons.
The link is the file
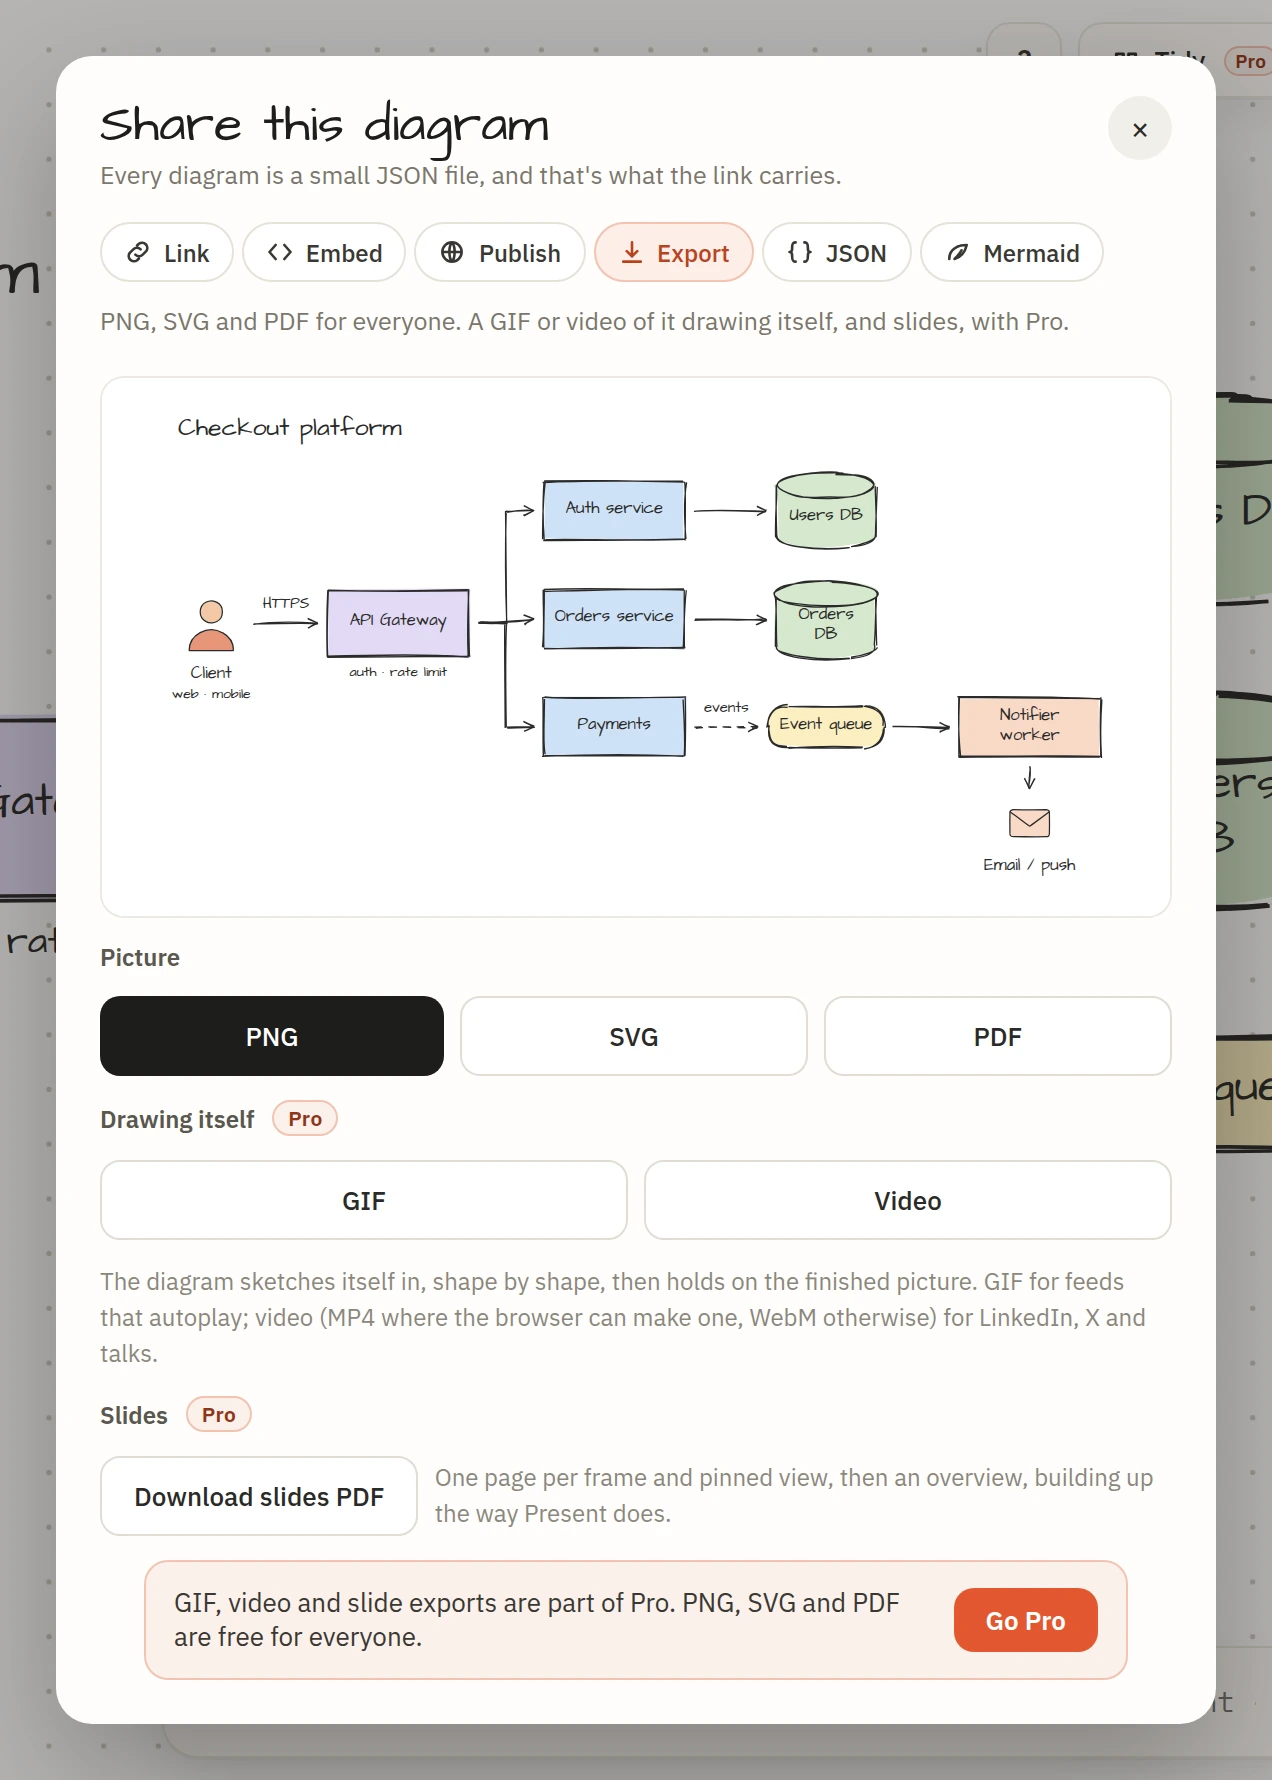
When you share a diagram, the whole thing travels inside the URL, compressed. The person on the other end doesn't need an account, and nothing gets uploaded unless you choose to publish. You can also export a PNG, an SVG with the fonts baked in, a PDF, the raw JSON, or Mermaid text (and paste Mermaid back in).
If you sign in
Sign in with Google and your diagrams save to your account as you edit, so you can open them anywhere. The free plan keeps ten. Pro ($6 a month, or $48 a year) makes that unlimited and adds version history, publishing and embeds, plus the GIF, video and slides exports.
Where to start
Open the canvas, press /, and type the last system you drew on a whiteboard. If you'd rather start from something, the Open button has templates: architecture, a RAG pipeline, a flowchart, a data model, a state machine. I'd love to hear what you draw with it.